I decided to look at my home energy usage. Below are notes on how I’m approaching it. I wish I could get insight from the MIOS graphing plugin, but it is pretty basic and can’t throw out outliers and has terrible zoom capability. I also never figured out how to set the y-axis.
In order to build a plot, I considered the following options:
- Use a custom javascript library that has zoom capability (i.e. re-purpose a stock chart)
- Use MATLAB
I had to use MATLAB (or similar) to condition the data in any case. First, I had to scp the data over from my Vera. For example:
scp remote@micasa:/dataMine/database/10/raw/2302.txt tmp/10_2.txt
Which I was able to pull together using some MATLAB:
Since I monitor both legs of my electrical setup, I would have two plots. Here is what my MATLAB code currently produces (click on the plot below to do some analysis):
I’m not happy with this plot. It is hard to get at the events that are happening. I can’t easily put vertical bands on because the units are all strange with the time series plot. I definitely can’t browse the data and get insight for what is happening. I also want to add both datasets together so I can see total energy consumption.
Additional data from Dominion Power
Also, as part of my analysis. I pulled together some historical data from Dominion.
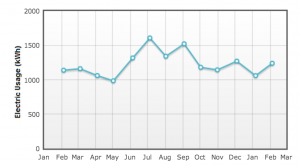
Actual Data
| Meter Read Date | Days | Usage | Daily Usage |
| 02/04/2014 | 29 | 1240 | 43 |
| 01/06/2014 | 33 | 1060 | 32 |
| 12/04/2013 | 34 | 1271 | 37 |
| 10/31/2013 | 29 | 1144 | 39 |
| 10/02/2013 | 29 | 1181 | 41 |
| 09/03/2013 | 32 | 1523 | 48 |
| 08/02/2013 | 28 | 1342 | 48 |
| 07/05/2013 | 30 | 1608 | 54 |
| 06/05/2013 | 34 | 1318 | 39 |
| 05/02/2013 | 28 | 985 | 35 |
| 04/04/2013 | 30 | 1061 | 35 |
| 03/05/2013 | 29 | 1161 | 40 |
| 02/04/2013 | 31 | 1139 | 37 |
Table 2 — From Dominion Power
| Meter Read Date | Days | Meter Reading Method | Meter Read | Usage (kWh) | Demand | Avg. Daily Usage |
|---|---|---|---|---|---|---|
| 01/06/2014 | 33 | 6929 | 1060 | 0.0 | 32 | |
| 12/04/2013 | 34 | 5869 | 1271 | 0.0 | 37 | |
| 10/31/2013 | 29 | 4598 | 1144 | 0.0 | 39 | |
| 10/02/2013 | 29 | 3454 | 1181 | 0.0 | 41 | |
| 09/03/2013 | 32 | 2273 | 1523 | 0.0 | 48 | |
| 08/02/2013 | 28 | 750 | 1342 | 0.0 | 48 | |
| 07/05/2013 | 30 | AMR – MOBILE READ BY VAN | 19247 | 1608 | 0.0 | 54 |
| 06/05/2013 | 34 | AMR – MOBILE READ BY VAN | 17639 | 1318 | 0.0 | 39 |
| 05/02/2013 | 28 | AMR – MOBILE READ BY VAN | 16321 | 985 | 0.0 | 35 |
| 04/04/2013 | 30 | AMR – MOBILE READ BY VAN | 15336 | 1061 | 0.0 | 35 |
| 03/05/2013 | 29 | AMR – MOBILE READ BY VAN | 14275 | 1161 | 0.0 | 40 |
| 02/04/2013 | 31 | AMR – MOBILE READ BY VAN | 13114 | 1139 | 0.0 | 37 |
| 01/04/2013 | 32 | AMR – MOBILE READ BY VAN | 11975 | 1341 | 0.0 | 42 |
|
Totals
|
16,134
|
Some links:
I’m out of time this morning, but when I get more time, I’m going to be considering the following:
Leave a Reply