
In today’s crowded used‐EV market, it can be nearly impossible to sift through hundreds of messy web pages and figure out what really drives a Tesla Model Y’s price. That’s why I’m taking a data‐first approach: we’ll pull the full listing text for 250 Long Range Model Ys from CarMax (despite their tangled HTML), clean and organize it into a Google Sheet, then feed it into R. With just a few lines of R code we’ll plot price against both model year and odometer reading, fit a simple linear regression, and package it into an easy-to-use price-estimator function. Finally, we’ll repeat the process on Carvana data and compare the two—to reveal exactly how much “newness” vs. “mileage” each dealer rewards, and help you pinpoint the ideal Year/Mileage combination so you can drive away in your sweetest Model Y deal without ever overpaying.
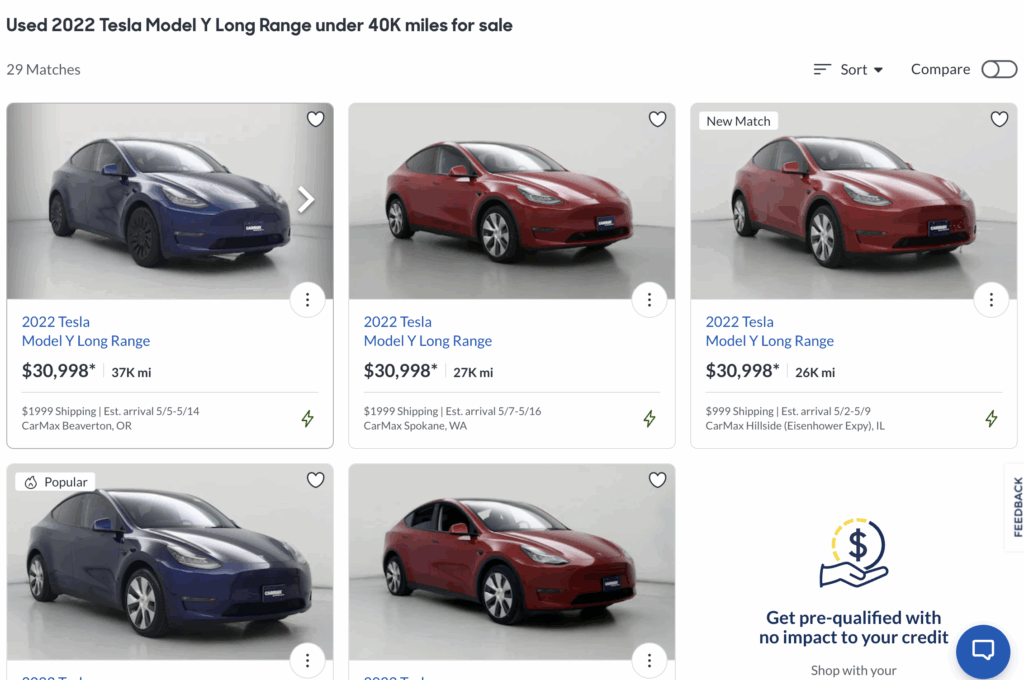
To do this, I pull up https://www.carmax.com/cars/tesla/model-y/long-range?showreservedcars=false.
The html is super messy, but you can display everything with a couple clicks, select all and copy and give the text on 250 cars to chatgpt to make a nice table in google sheets. (Something I used to write a lot of code and headless browsing to do. Now just copy and paste the mess into an LLM.)
Then with this r script, I could build a little model:
How much does age affect price (about $2000/yr)

And how much does mileage affect price? (every additional mile reduces the predicted price by about 9 cents)
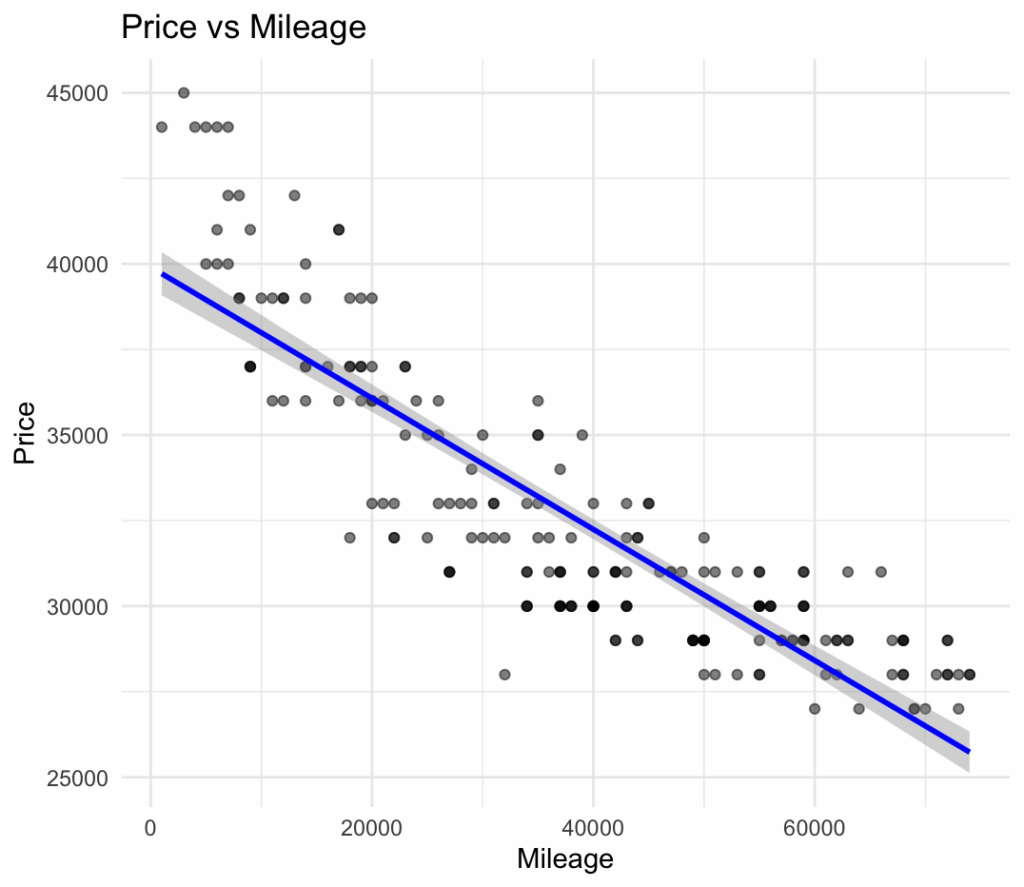
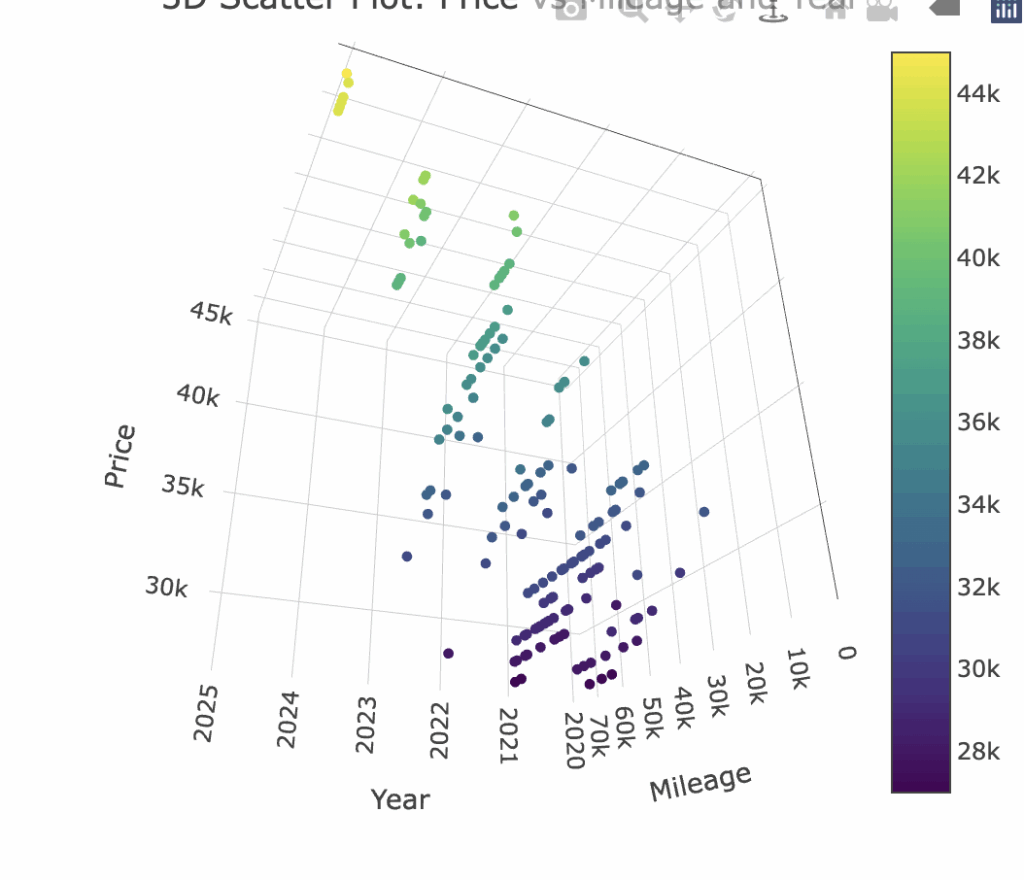
We can make a model that looks at both variables and a linear model fits pretty well.
summary(model)

Call:
lm(formula = Price ~ Year + Mileage, data = df)

Residuals:
    Min      1Q  Median      3Q     Max
-3726.0  -857.4    86.9   801.9  2871.1

Coefficients:
              Estimate Std. Error t value Pr(>|t|)
(Intercept) -3.979e+06  2.191e+05  -18.16   <2e-16 ***
Year         1.986e+03  1.083e+02   18.35   <2e-16 ***
Mileage     -9.353e-02  7.103e-03  -13.17   <2e-16 ***
---
Signif. codes:  0 ‘***’ 0.001 ‘**’ 0.01 ‘*’ 0.05 ‘.’ 0.1 ‘ ’ 1
The linear model predicting Tesla Model Y prices based on Year and Mileage shows a very strong fit to the data. The multiple R-squared value is 0.9092, indicating that approximately 91% of the variation in Price is explained by the two predictors. Both Year and Mileage are highly statistically significant (p-values < 2e-16), confirming that newer vehicles and lower mileage are strong predictors of higher prices. The coefficient for Year is approximately $1,986, meaning each additional year (newer) increases the predicted price by about $2,000, holding mileage constant. Conversely, the coefficient for Mileage is approximately -9 cents per mile, meaning every additional mile reduces the predicted price by about 9 cents. The residual standard error is $1,287, suggesting that the typical prediction error is around $1,300, which is relatively small compared to the average vehicle price in the dataset. Overall, the model demonstrates excellent explanatory power and precision for this pricing prediction task.
So then it’s easy to build a function to check if the price is right:
> estimate_price <- function(year, mileage) {
+     predict(model, newdata = data.frame(Year = year, Mileage = mileage))
+ }
> estimate_price(2024, 20000)
We can then build a model to compare carvana and carmax by doing the same thing to Carvana’s web page:
[1] "Model Coefficient Comparison:"
                   Term        Carmax       Carvana    Difference
(Intercept) (Intercept) -3.979085e+06 -3.103468e+06 -8.756172e+05
Year               Year  1.986047e+03  1.551575e+03  4.344724e+02
Mileage         Mileage -9.352694e-02 -8.777679e-02 -5.750151e-03
`geom_smooth()` using formula = 'y ~ x'
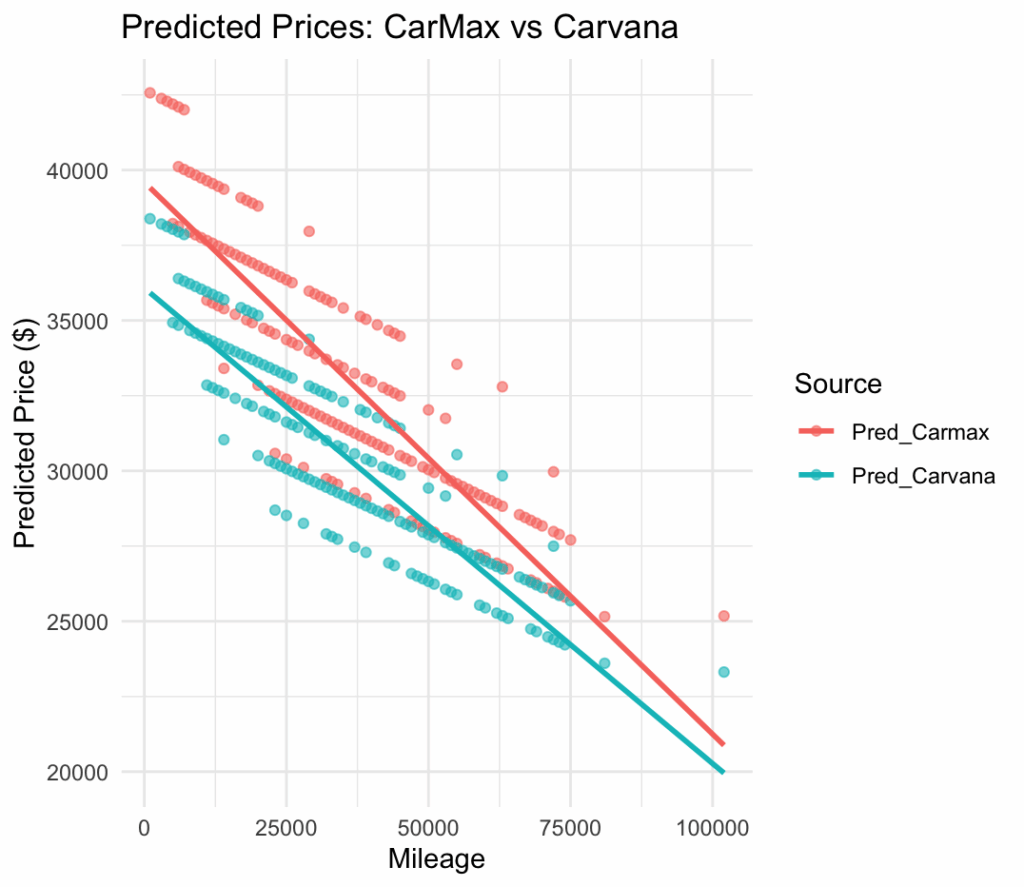
When comparing the pricing models between CarMax and Carvana for used Tesla Model Y vehicles, some notable differences emerge. Both models fit a simple linear regression of Price ~ Year + Mileage, but their coefficients tell an interesting story. CarMax vehicles show a slightly higher sensitivity to the vehicle’s year, with a coefficient of $1,986 per year compared to Carvana’s $1,552 — meaning newer cars retain more value at CarMax. Meanwhile, the mileage penalty (the amount price drops per additional mile) is steeper at CarMax, at about 9.35 cents per mile, compared to 8.78 cents at Carvana. Overall, CarMax’s prices tend to start lower. This suggests that CarMax is pricing aggressively lower on older, higher-mileage vehicles, while Carvana offers slightly higher baseline prices but discounts mileage more gently. These differences could reflect strategic positioning: CarMax competing more on price, Carvana offering a convenience premium.
If we anchor both models at a typical vehicle—say a 2022 Model Y with 49 000 miles, this is all pretty clear:
- CarMax prediction: > $–3 979 000 + 1 986 × 2022 – 0.0935 × 49 000 ≈ $32 100
- Carvana prediction: > $–3 103 500 + 1 552 × 2022 – 0.0878 × 49 000 ≈ $29 500
So on an average 2022, 49,000 mi car, CarMax’s model actually prices it about $2,600 higher than Carvana’s. In practical terms, CarMax seems to lean on year more heavily—charging a steeper premium for newer cars—while also carving off more per mile of wear. Carvana, by contrast, starts a little higher (gentler intercept) but discounts mileage more slowly, resulting in lower predicted prices on higher‐mileage examples. This aligns with CarMax’s more aggressive price‐based positioning on older, higher‐use vehicles and Carvana’s strategy of a slightly higher baseline with more gradual mileage adjustments.
So now we have an estimate_price(2024, 20000) function which tells us: 38803.62
So what should I buy if I’m looking for the sweet spot between value, battery health, and “new‐feel,” my models suggest targeting roughly a 2021–2022 Model Y with 20 000–30 000 miles on the odometer. Here’s why:
- Battery life: Tesla batteries typically lose around 2–3% capacity per year plus 2% per 10 k miles. A 2022 car with ~30 k miles will still have around 90–93% of original capacity—plenty of range for daily driving and road trips.
- Price:
- CarMax predicts about $34 000 for a 2022/30 k example,
- Carvana predicts about $32 000—so you’re looking at $32–34 k in that neighborhood.
- Value boost: Jumping up to 2023 shaves less than $1000 off mileage penalties but adds $1500–2000 on the year premium; dropping down to high‐mileage 2020s saves only ~$3000 but costs you 15–20% battery health.
Bottom line: A 2021–2022 Tesla Model Y with 20,000–30,000 mi strikes the best balance—excellent battery life (≥90%), newer features, and a sweet spot in the $32–34 krange. If you can stretch to 2022 and keep mileage under 25k, you’ll maximize both range and resale value without overpaying.