Used Mountain Bike Prices
Note: Check out the app and try the model for yourself.
UPDATE: Need to incorporate Pink Bike!
Fresh off a weekend of riding in Bentonville, I realized I need to replace my 2006 Gary Fisher Cake. But I’m data driven and love figuring out a market before I dive in. I wanted more than crowd-sourced hunches about bike pricing; I wanted numbers I could trust. New mountain bikes shed value fast—roughly 30-40 % disappears in the first year, then depreciation flattens to about 8-12 % per year until the geometry or drivetrain standard goes obsolete. Carbon frames, high-end suspension, and “halo” brands (Yeti, Santa Cruz, Pivot) hold value better than entry-level aluminum builds, yet even they nosedive if a service-heavy fork or out-of-fashion wheel size is involved. Used-bike sites quote asking prices, not what bikes actually clear for, and algorithmic estimates rarely account for regional demand or component mix. So I scraped Craigslist, Facebook Marketplace, and Bicycle Blue Book, built my own price model, and now shop with a spreadsheet instead of wishful thinking—seeing at a glance whether that $2,400 Fuel EX is a bargain.

Getting the Data
To build this bike listings dataset, I used a combination of scraping tools and manual extraction strategies across three major platforms: Craigslist, Facebook Marketplace, and Bicycle Blue Book.
For Craigslist, I automated the process end-to-end. I wrote a script (download_cl_raw.py) to fetch city-specific HTML pages using a custom User-Agent and parsed embedded JSON-LD blocks to extract listing data (which you can see here). This raw data was then processed by analyze_and_load_cl.py, which parses structured fields (e.g., brand, model, year, frame material) using regexes and known brand patterns. Only well-known mountain bike brands were retained to ensure data quality.
Facebook Marketplace posed more challenges due to limited APIs and anti-bot measures. To work around this, I manually saved listing pages via the Chrome Developer Tools (see my data here), then used BeautifulSoup (facebook_parser.py) to extract the price, location, and other specs from the HTML. Brand and model parsing reused similar regex-based logic.
For Bicycle Blue Book, I also manually downloaded the listing HTML (data here) and used a script (bb_extractor.py) to extract structured rows like name, type, size, and price using CSS selectors.
Finally, all listings were normalized, cleaned (e.g., prices cast from “$2,800” strings to numeric), and inserted into a fresh PostgreSQL table (bike_listings_new) using upload_bikes.py.
This multi-pronged approach resulted in 1,861 listings with high coverage of core fields like brand, model, year, and price, though fields like frame_size and suspension remain sparsely populated. The dataset now supports robust price modeling, brand comparisons, and cross-market analysis.
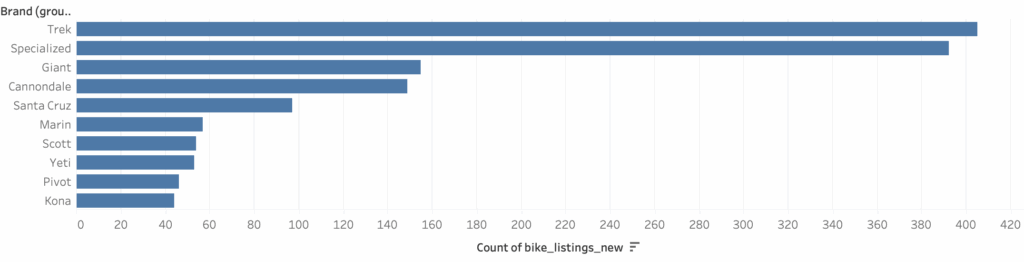
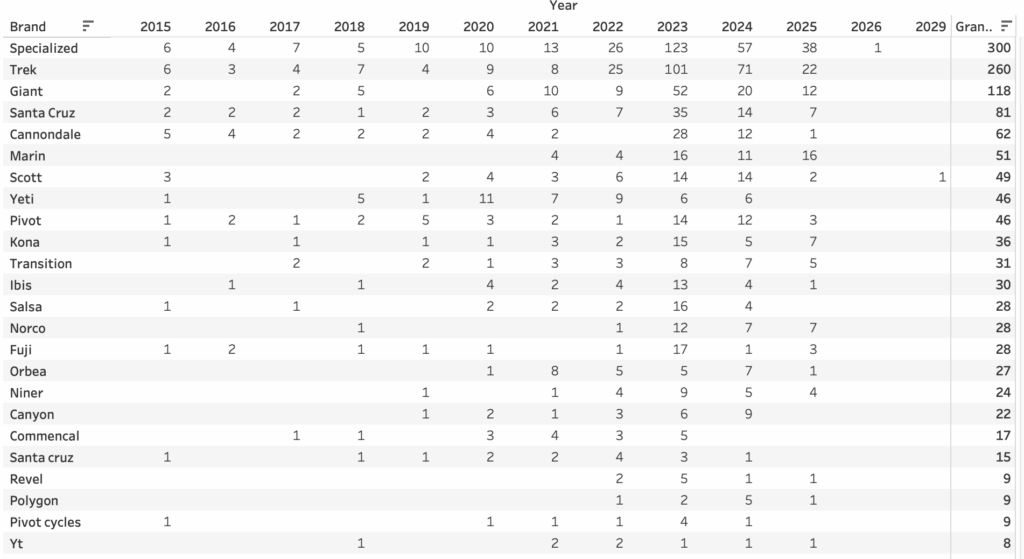
The most represented brands are Specialized (300 bikes), Trek (260), and Giant (118), with most listings concentrated in recent years like 2023 and 2024. Specialized alone accounts for over 100 bikes listed in 2023, showing clear popularity and availability on the secondhand market. Model year coverage spans from 2015 to 2025, with the majority of data coming from the last five years. In terms of data completeness, core fields like title, price, brand, and year are over 95% populated, while others such as frame_size, wheel_size, and drivetrain have much sparser coverage. Notably, only 20% of entries have frame_size and less than 10% have detailed mechanical specs like brake_type or suspension. This makes broad comparisons possible on price and brand, but highlights the challenges in making deeper component-level comparisons—especially since components and condition may vary significantly even within the same model and year. Nonetheless, the dataset offers a strong foundation for analyzing used bike market trends, pricing gaps between platforms, and brand popularity over time.
Some parameters I could get 100% coverage, while there was nearly no data on tires or suspension travel. You should check out this monster query to generate this table.
| column_name | populated_count | missing_count | total_rows | percentage populated |
| id | 1861 | 0 | 1861 | 100 |
| city | 1861 | 0 | 1861 | 100 |
| post_date | 1861 | 0 | 1861 | 100 |
| price | 1861 | 0 | 1861 | 100 |
| currency | 1861 | 0 | 1861 | 100 |
| title | 1861 | 0 | 1861 | 100 |
| brand | 1861 | 0 | 1861 | 100 |
| scraped_at | 1861 | 0 | 1861 | 100 |
| source | 1861 | 0 | 1861 | 100 |
| model | 1854 | 7 | 1861 | 99.62 |
| year | 1794 | 67 | 1861 | 96.4 |
| frame_material | 1735 | 126 | 1861 | 93.23 |
| original_model | 1682 | 179 | 1861 | 90.38 |
| location | 1679 | 182 | 1861 | 90.22 |
| frame_size | 378 | 1483 | 1861 | 20.31 |
| url | 237 | 1624 | 1861 | 12.74 |
| wheel_size | 173 | 1688 | 1861 | 9.3 |
| drivetrain | 95 | 1766 | 1861 | 5.1 |
| brake_type | 47 | 1814 | 1861 | 2.53 |
| suspension | 12 | 1849 | 1861 | 0.64 |
| tire_brand | 2 | 1859 | 1861 | 0.11 |
| travel | 1 | 1860 | 1861 | 0.05 |
Initial Observations
My first question, was how prices compare between facebook, craiglist and bicycle bluebook. Craigslist prices are systematically lower—often by 20–50%, and sometimes by multiples—for the same year+model. eg. in 2019 Switchblade: CL $1,500 vs FB $2,000 and SB150: CL $3,300 vs FB $3,600. BicycleBluebook, when present, sits between Craigslist and Facebook, acting as a mid-market reference. This supercool sql let me compare the sites.
| year | model | avg craigslist | avg facebook | avg bb | abs spread | max_min ratio |
| 2024 | Marlin 6 | $2,800.00 | $500.00 | $2,300.00 | 5.6 | |
| 2024 | Stumpjumper | $1,026.25 | $2,375.00 | $1,348.75 | 2.31 | |
| 2023 | Tallboy | $1,150.00 | $2,600.00 | $1,450.00 | 2.26 | |
| 2023 | Stumpjumper | $1,085.00 | $2,371.67 | $1,286.67 | 2.19 | |
| 2024 | Fuel EX 8 | $1,108.33 | $2,300.00 | $1,191.67 | 2.08 | |
| 2024 | 141 | $3,500.00 | $1,900.00 | $1,600.00 | 1.84 | |
| 2021 | SB95 | $1,500.00 | $2,500.00 | $1,000.00 | 1.67 | |
| 2021 | SB150 | $2,000.00 | $3,200.00 | $1,200.00 | 1.6 | |
| 2022 | Trance X 3 | $1,200.00 | $1,900.00 | $700.00 | 1.58 | |
| 2023 | Fuel EX 5 | $856.25 | $1,350.00 | $493.75 | 1.58 | |
| 2022 | Spark 960 | $1,849.00 | $1,200.00 | $649.00 | 1.54 |
When comparing average bike prices across Craigslist, Facebook, and BicycleBluebook for the same year and model, there are striking disparities. Similar spreads are evident for popular models like the Stumpjumper and Tallboy, where Facebook listings consistently command significantly higher prices. In other cases, such as the Fuel EX 8 and SB150, the Craigslist price is notably lower by over $1,000 on average. While these differences are compelling, it’s important to note that they may reflect variations in bike condition, component specs, and seller expectations rather than pure market inefficiency. Still, the consistent patterns suggest that Craigslist may offer lower-priced listings on average, while Facebook often reflects a more premium price tier.
Does the city matter?
(no, cuz this market is crazy)
From some quick analysis, most brand-model-year combinations appear in only one city, so their local average simply is the national average (100 % rows). There is just not enough clean data to answer this question and the one conclusion I take away is that bike pricing is a super inefficient market. Where a combo shows up in two markets the price gaps are striking: a 2025 “unknown” Specialized lists for $750 on Seattle’s boards— about 50 % above the national mean—while the same mystery build averages only $240 in Chicago (≈ 50 % below). Likewise, 2023 Trek “unknowns” fetch $1,348 in Denver (151 % of national) but just $433 in Los Angeles (49 %). Even with tiny sample sizes (3–5 bikes each), the pattern suggests regional demand and seller optimism can swing asking prices for identical vintage-and-brand bikes by a factor of two or more.
A more sophisticated check backs this up. Only one usable “city” dummy survived the frequency filter, and LightGBM never bothered to split on it—its total gain and split count are both zero. When we rebuilt the model with the city column entirely removed, the median-absolute-error stayed exactly the same ($1,082). In short, regional location adds no predictive power in this data; age, brand, and frame material explain nearly all of the price variation we can capture, while the city a bike is listed in appears irrelevant.
Model
I built a model to sift through thousands of real listings—accounting for brand reputation, frame material, the bike’s age, and even how prices vary from city to city—to predict a fair, middle-of-the-road price in seconds. Think of it as my own personal Kelley Blue Book for bikes.
Under the hood, the valuation engine marries a classic machine-learning preprocessing stack with a modern gradient-boosted quantile regressor. Continuous bike attributes (age, log-age) sail through a median-imputer, while brand, frame material, size, and city are one-hot–encoded with frequency pruning so the feature matrix stays lean even as new makes appear. I trained with GroupKFold keyed on city—crucial for second-hand markets where geography drives pricing—to guarantee our test fold is a truly out-of-town set. A ridge model gives a transparent linear baseline, but the production scorer is a LightGBM quantile model at \(\alpha = 0.5\), which directly learns the market median. Boosting captures the steep price cliffs between prestige brands and commodity frames, while quantile loss hedges against outliers that plague classifieds. The result is a file-light pipeline (preprocessor + model serialized at ~ MBs) that returns instant, geographically realistic price medians—ideal for auto-pricing listings, negotiating buys, or flagging bargains the moment they’re scraped.
You can see all the code and results here at my google colab.
Top features by total gain:
                         feature      score
4   cat__frame_material_Aluminum  83.397947
0                       num__age  40.415536
3  cat__brand_infrequent_sklearn  29.515867
5     cat__frame_material_Carbon  15.131043
1                   num__log_age   8.443574
2          cat__brand_Santa Cruz   5.624613
6        cat__frame_size_missing   0.000000
7           cat__city_Fort Worth   0.000000
The LightGBM model’s own score-gain metrics say the single most powerful signal in predicting a used-bike’s median price is simply whether the frame is aluminum (gain ≈ 83). In other words, the algorithm most often chooses to split first on “Aluminum vs. everything else,” because that decision alone lops the most error off its price guesses. Classic depreciation comes next: the bike’s age in years carries roughly half as much influence (gain ≈ 40), confirming that time on the trail is the second-biggest driver of resale value. A close third is an umbrella flag for infrequent or boutique brands—if a listing’s brand falls outside the mainstream, the model adjusts sharply (gain ≈ 30). Carbon frames still matter but noticeably less than aluminum/other (gain ≈ 15), and finally the log-age term (gain ≈ 8) offers the model a gentle curve to fine-tune how price drops level off as bikes get very old. Funny to see the Santa Cruz brand effect too.
Net takeaway: material and time dominate; brand prestige matters mainly at the extremes, and once the model knows those things, everything else is icing.
Elisa Pasquali
May 27, 2025 at 8:13 am
This is super awesome and I love that you link to your code. I’m just getting started with data science and ML so learning how you did things from scratch gives me a cool example to follow for my current studies and learnings.
Amazing job, Tim!