A runner becomes a biker
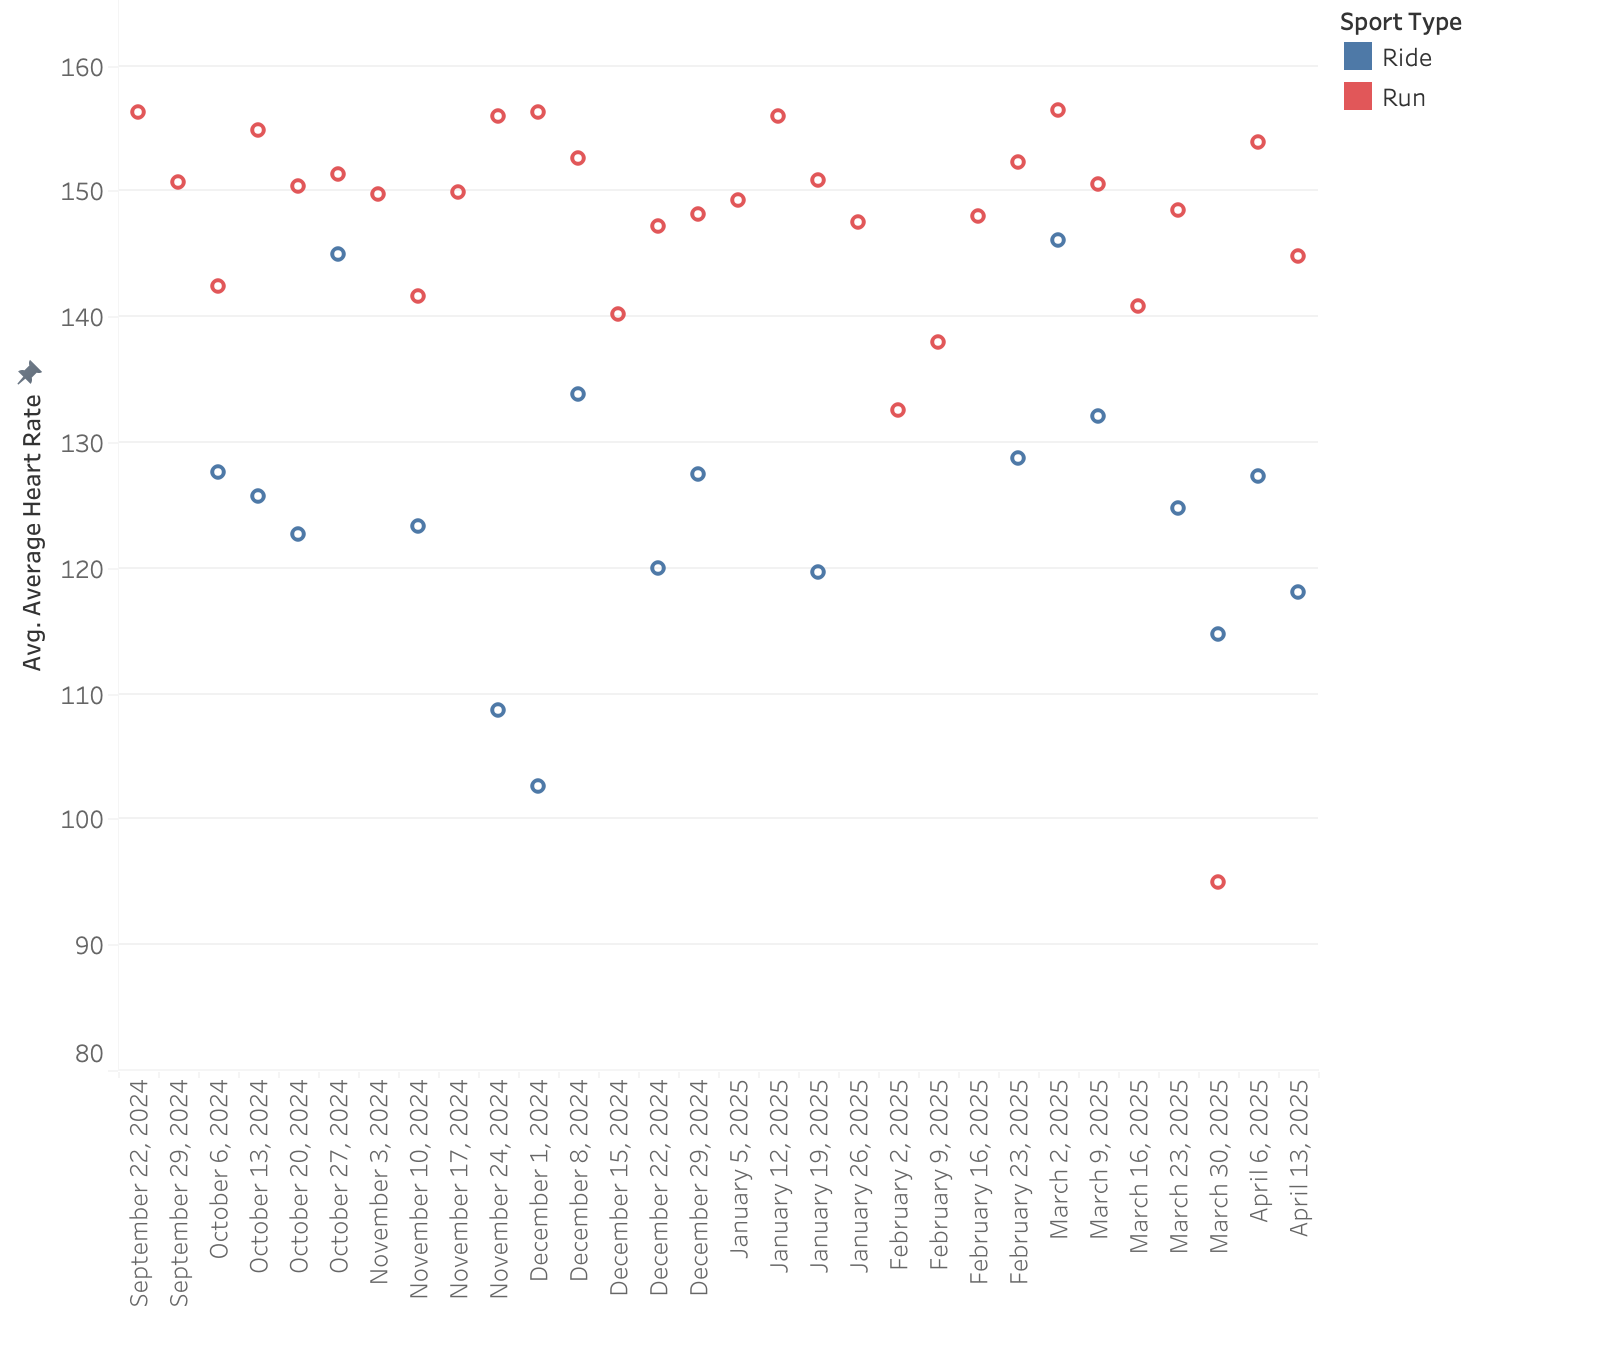
I can’t get my heart rate up on the bike, even when I feel I’m pushing hard. I grind up hills, spin through flats, and yet it’s hard to get above 120–130 bpm. I run at 160 bpm and race at 170-180. Cycling is a very muscle‑specific sport. Unlike running, where your whole body (and the … Read more